Last week, Allstate insurance published a press release, with a graph displaying the number of accidents in 2010, grouped and sorted by Zodiac sign. The data was based on the actual birthdays of customers. At first glance, one would be surprised to find that Virgos have a much worse driving record (8 times as many accidents!) than Scorpios. Astrologists and the superstitious would actually expect a lower accident rate for Virgos, known as perfectionists. On the other hand, "compulsive and obsessive" Scorpios would be expected to speed and exhibit risky behavior including tailgating and frequent lane-changing, leading them to a higher accident rate. Rational people would also be surprised at the results, expecting a uniform distribution of accident rates, with no dependency on Zodiac signs.
So what is going on here?
Some background on the Zodiac calendars
Most of the information here can be found in the Wikipedia article on the Zodiac. A video on YouTube by dupeduperson also helped me to visualize this.
Three types of Zodiac systems exist: Tropical, Sidereal, and IAU constellation boundaries. The basic principle shared between these systems is that the year is divided into 12 (or 13) periods, each of them associated with a constellation. At a given period, the sun, the earth, and a given constellation are aligned (the sun between the earth and the constellation).
In western culture, the tropical system is the most well known. In this system, the year is divided into twelve equal parts. When the system was first created, sometime around the 7th century BC, on the first day of spring (the vernal equinox), the sun was "pointing" to the Aries constellation. The first month of spring was therefore associated with the Aries constellation, and the other eleven months associated with the nearest aligned constellation for that time of year, as the earth rotated around the sun.
The seasons of the earth (and our current Gregorian calendar), however, do not depend on the position of the earth around the sun, but rather how much, and in what direction, the given hemisphere of the earth is tilted towards or away from the sun. The time between the vernal equinoxes, and the time for the Earth to complete its orbit around the Sun, are almost equal, but not quite. This is due to gradual change in the tilt of the Earth's axis of rotation about itself (precessional cycle). A page from the NCDC website has some graphics which are helpful in understanding this. The earth takes about 365.256363 days to rotate around the sun, but the time between vernal equinoxes (the length of a calendar year) is 365.242374. This slight difference means that each year, at the beginning of spring (March 20 or 21), the earth is in a slightly different position on its orbit around the sun, thus with a slightly different alignment with the constellations. (The positions of the constellations, relative to the sun, are for practical purposes permanent.) Hundreds of years since the creation of the tropical Zodiac calendar, the sun is no longer aligned with the Aries constellation on the first day of spring. However, in the tropical Zodiac system, the beginning of spring has continued to be traditionally associated with Aries, regardless of the actual alignment of the constellation.
The Sidereal (Hindu) Zodiac system takes the precessional cycle into account. In the Sidereal Zodiac system, the Zodiac periods are based on the position of the Earth in its orbit around the Sun, and thus based on the alignment with the constellations (and not with the seasons of the Earth). Because of this, the dates of each period change over time. In 2011, The Aries period in the Sideral system begins on April 14, while the Aries period in the tropical system begins, as it always has (applying the Gregorian calendar retroactively), on March 21.
One inaccuracy shared by both the Tropical and Sidereal systems is that the periods are all of equal length. Some of the constellations (such as Virgo) cover a much wider area of space, viewed from Earth, than others (such as Scorpio). In the earlier part of the last century (1920s and 1930s), the Internal Astronomical Union (IAU) mapped the boundaries of the constellations. Since the constellations have varying size, a Zodiac calendar which most closely represents the alignment of the Sun with the constellations would use the IAU constellation boundaries and have periods of varying length. In such a system, the Virgo period is currently from September 17 to October 31 (44 days), while the Scorpio period is from November 21 to November 30 (only 9 days). In addition, using the IAU constellation mappings, a new thirteenth period is introduced - Ophiuchus
Accident statistics: which Zodiac signs are really more at risk?
We can see from Allstate's chart that the IAU constellation system was used, as Ophiuchus is included. If we assume that people are born uniformly throughout the year, we can estimate the percentage of the population born during each Zodiac sign in the IAU system. We can also find the Zodiac sign distribution using some datasets of birthday distributions:
| Start Date | End Date | Number of Days | Uniform birthday distribution | Life Insurance 1981-1984 birthdays | US 1978 birthdays | |
| Aries | Apr 19 | May 14 | 25 | 6.8% | 6.5% | 6.4% |
| Taurus | May 14 | Jun 21 | 38 | 10.4% | 10.1% | 10.1% |
| Gemini | Jun 21 | Jul 21 | 30 | 8.2% | 8.4% | 8.5% |
| Cancer | Jul 21 | Aug 11 | 21 | 5.8% | 6.0% | 6.1% |
| Leo | Aug 11 | Sep 17 | 37 | 10.1% | 10.6% | 10.8% |
| Virgo | Sep 17 | Oct 31 | 44 | 12.1% | 12.6% | 12.6% |
| Libra | Oct 31 | Nov 21 | 21 | 5.8% | 5.7% | 5.8% |
| Scorpio | Nov 21 | Nov 30 | 9 | 2.5% | 2.4% | 2.5% |
| Ophiuchus | Nov 30 | Dec 18 | 18 | 4.9% | 4.9% | 5.0% |
| Sagittarius | Dec 18 | Jan 21 | 34 | 9.3% | 9.2% | 9.1% |
| Capricorn | Jan 21 | Feb 17 | 27 | 7.4% | 7.3% | 7.2% |
| Aquarius | Feb 17 | Mar 12 | 23 | 6.3% | 6.3% | 6.2% |
| Pisces | Mar 12 | Apr 19 | 38 | 10.4% | 10.1% | 9.9% |
| Total | 365 | 100% | 100% | 100% |
The start and end dates are based on the 2011 dates from Wikipedia.
Given the accident statistics published by Allstate, we can calculate the percentage of accidents per Zodiac sign:
| Number of Accidents | Percent of Accidents | |
| Aries | 112,402 | 6.6% |
| Taurus | 177,503 | 10.4% |
| Gemini | 136,904 | 8.0% |
| Cancer | 101,539 | 6.0% |
| Leo | 179,657 | 10.6% |
| Virgo | 211,650 | 12.4% |
| Libra | 110,592 | 6.5% |
| Scorpio | 26,833 | 1.6% |
| Ophiuchus | 83,234 | 4.9% |
| Sagittarius | 154,477 | 9.1% |
| Capricorn | 128,005 | 7.5% |
| Aquarius | 106,878 | 6.3% |
| Pisces | 172,030 | 10.1% |
| Total | 1,701,704 | 100% |
Now we can combine the two tables and compare the percent of accidents per Zodiac sign to the percent of the population per Zodiac sign:
| Percent of Population (Uniform dist.) | Percent of Accidents | |
| Aries | 6.8% | 6.6% |
| Taurus | 10.4% | 10.4% |
| Gemini | 8.2% | 8.0% |
| Cancer | 5.8% | 6.0% |
| Leo | 10.1% | 10.6% |
| Virgo | 12.1% | 12.4% |
| Libra | 5.8% | 6.5% |
| Scorpio | 2.5% | 1.6% |
| Ophiuchus | 4.9% | 4.9% |
| Sagittarius | 9.3% | 9.1% |
| Capricorn | 7.4% | 7.5% |
| Aquarius | 6.3% | 6.3% |
| Pisces | 10.4% | 10.1% |
| Total | 100% | 100% |
We can plot the accident data and Zodiac sign distribution on a chart similar to the Allstate graphic:
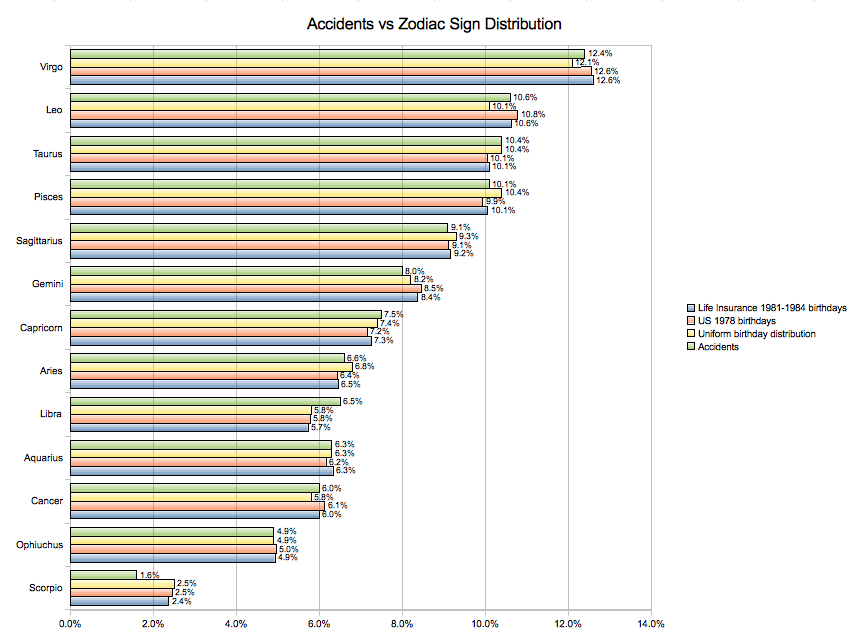
As we can see, the percentage of accidents per Zodiac sign correlates directly with the percentage of people born in that Zodiac sign, with the biggest difference between accident rate and population percentage being less than 1% (for Scorpio).
Conclusion
The proportion of accidents per Zodiac sign is directly related to the percentage of the population born under that sign. In other words, Zodiac signs are no indication of risk of accidents. Being born under a particular sign does not impact an individual's personality in any way that would affect his or her driving record. There are more accidents involving Virgos simply because there are more Virgos out there driving cars.
Conclusion #2
a) This publicity by Allstate should have been received by the public as an obvious joke. Anybody who was offended by the press release should seek psychiatric counseling.
b) Perhaps Allstate could have anticipated the public's incapacity to understand or accept a joke, but it's really too bad they decided to retract it and apologize, saying “We deeply apologize for any confusion this may have caused.” Humor like this should be welcome in our society.

This work is licensed under a Creative Commons Attribution-NonCommercial-NoDerivs 3.0 Unported License.